
September is historically the toughest month for the US stock market. Wall Street is in the middle of the third quarter of the year, and so investors are again looking back at a seasonal pattern that has earned September a particularly bad reputation.
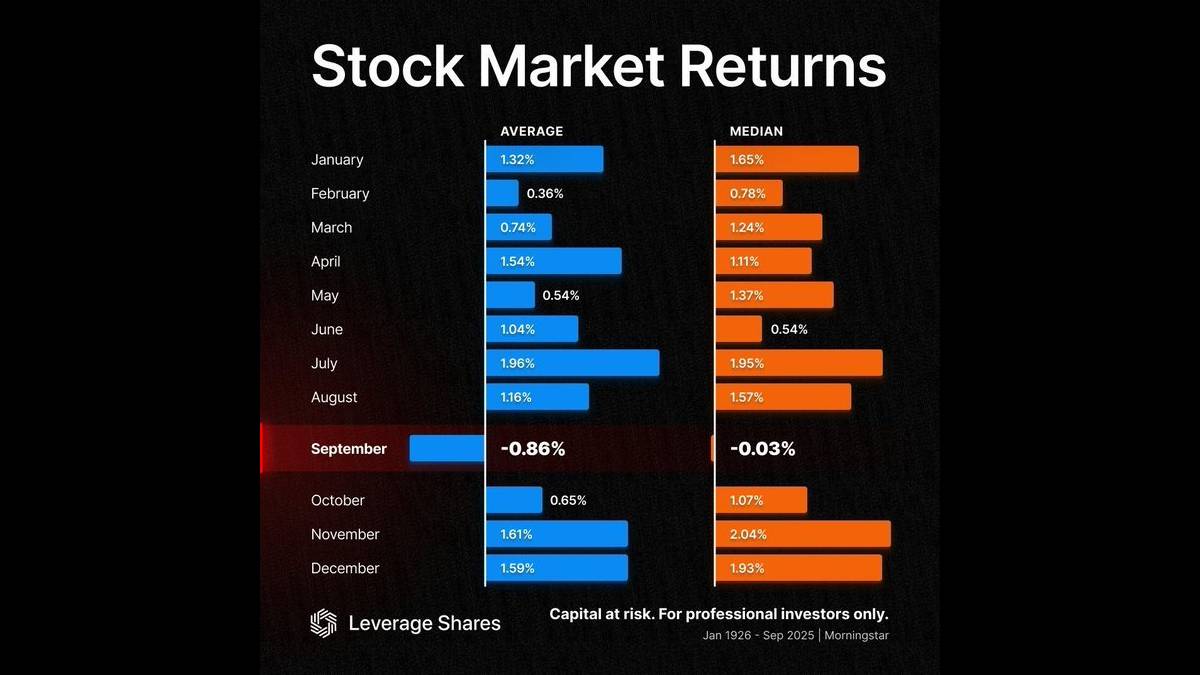
From historical data, September has been the poorest month for the S&P 500. For Dow Jones Market Data, it falls nearly 1.1% in September since 1928 as the worst month by average return.
And the weakness is not limited to the S&P 500. The Dow Jones Industrial Average has also historically had an average September decline of around 1.1%, while the Nasdaq Composite has averaged a drop of about 0.8% since 1971.
September also has one of the least frequent records of positive returns. In history, the S&P 500 has finished September higher in only about 44% of years, meaning declines have occurred more often than gains.
This recurrent seasonal pattern is often referred to as the “September Effect.” And it does not mean stocks will fall every September. In fact, markets have had strong September gains in some years, which is to say that seasonality is more a historical tendency than a reliable prediction.
There are a number of theories as to why equity in September is so difficult. More people may also trade as investors and fund managers return from the summer and start to reposition their portfolios. When trading volume is high, a big reaction to economic data, corporate news and market expectations come to the fore.
Another factor is the timing of key economic and monetary policy events. September often brings with it key US economic data such as employment figures, inflation readings and manufacturing indicators. The Federal Reserve's policy-setting meeting in September is also when investors are most closely watching interest-rate expectations.
This year’s setup is particularly interesting. The S&P 500 rose 2.6% in August, its best August since 2021, and the Nasdaq Composite rose 3.9% in August.
But the start of September 2026 has already led to some caution in markets. US stock futures were lower on September 1 as higher Treasury yields and higher oil prices weighed on investors’ sentiment. Renewed geopolitical tensions have added another layer of uncertainty.
But despite the recent history of weakness, some strategists say that investors should not be expecting September to be the start of a selling-off again. Market conditions, valuations, economic growth, corporate earnings and Federal Reserve policy can be so much more than seasonal patterns.
Technical positioning is another important factor to watch. The S&P 500 started September well above its 200-day moving average, which has historically been linked to a more durable market than the month after which it enters the month below that trend line.
For investors, the lesson is that September’s reputation should be taken as a risk signal, not a forecast. Markets can rise even when seasons are not favourable and economic fundamentals and corporate earnings are still strong.
And history is still a concern. With the S&P 500, Dow and Nasdaq all showing historically weak September averages, investors will be closely watching interest rates, inflation, employment data, oil prices, geopolitical developments and corporate earnings in the weeks ahead.
So we are in September, the month that has historically tested Wall Street’s resilience more than any other month. And whether 2026 follows the script or breaks the pattern is one of the biggest questions for US investors as we close out this year.





Comments
Please to leave a comment on this article.